Building a Five-Year AI Portfolio That Can Survive the Cycle
A public thought experiment in owning infrastructure, platforms, applications and adopters
IMPORTANT DISCLAIMER
This article is an educational research exercise. It is not financial advice, an investment recommendation, a solicitation, a prediction or a promise of future returns. It does not recommend that any reader buy, sell, short or hold any security, fund or asset.
The portfolios, returns and drawdowns below are hypothetical. They are not exact predictions, probability estimates or well-defined portfolios for any reader. Historical results use current portfolio selections and disclosed proxies, creating look-ahead, survivorship and proxy risk. Forward scenarios are assumptions—not forecasts or probabilities. Actual losses could exceed every stress shown here. Readers must make their own judgment calls.
The objective is to place a transparent idea in public, observe it over one, three and five years, and learn from how it performs against simpler assets.
The question
Suppose AI keeps improving for another five years.
Compute expands. Data centers consume more power. Hyperscalers invest. Agents enter software. Robotics improves. Traditional industries adopt AI.
How should an investor participate without making one crowded infrastructure bet the entire portfolio?
This post builds one possible answer.
The lesson from Situational Awareness
In my earlier article—AI Investment Cycles, Portfolio Concentration, and the Cost of Being Early—I examined the public evidence surrounding Leopold Aschenbrenner’s Situational Awareness thesis and a reported period of extreme fund volatility.
That article was not an argument against AI.
Its lesson was simpler:
A technology thesis, an industry forecast, a security and a financed portfolio are four different things.
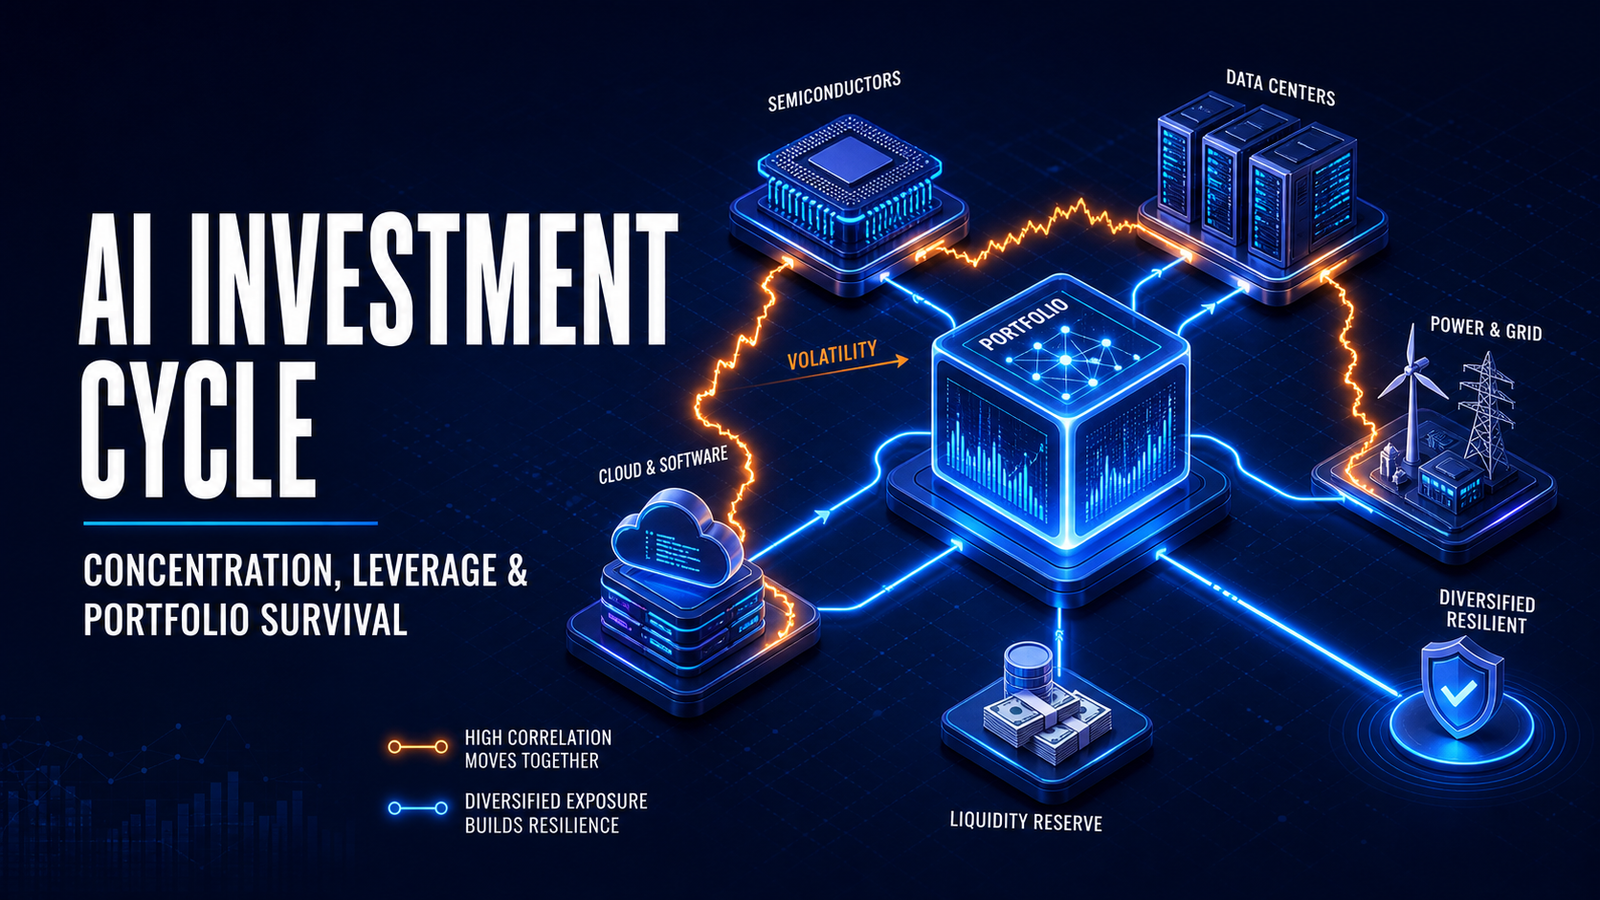
Many AI assets can appear diversified while depending on the same conditions: accelerating capital expenditure, cheap financing, high utilization and persistent scarcity.
When those expectations change, correlations can rise together. Leverage can then convert a temporary drawdown into a permanent loss of control.
This portfolio starts from the opposite direction: no borrowing, broad value-chain exposure and explicit stress limits.
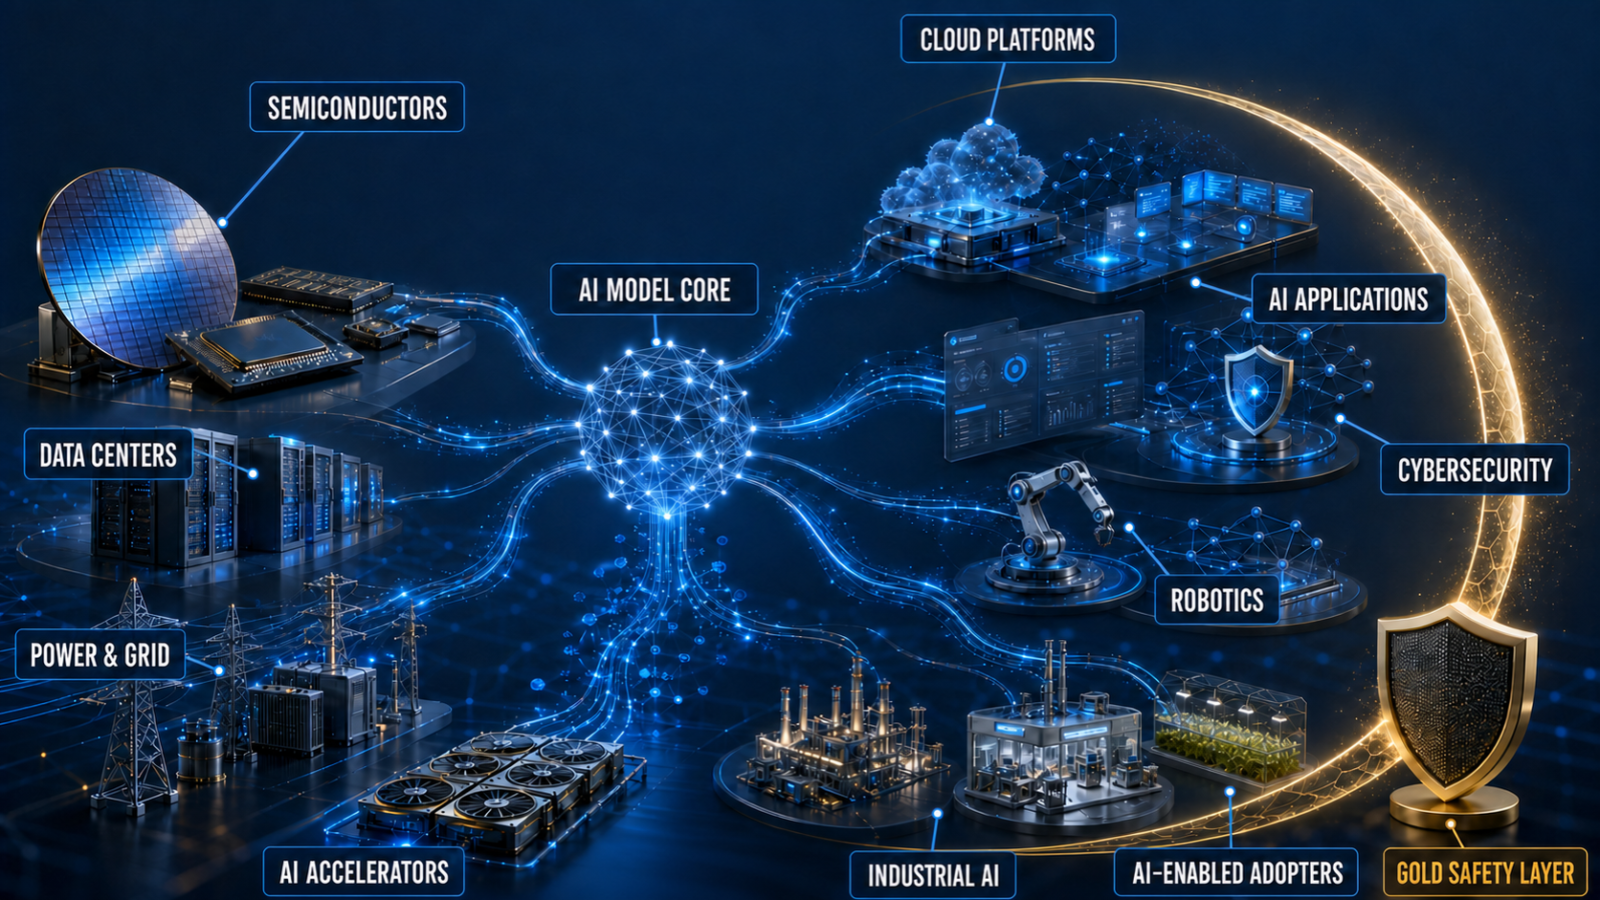
AI is a lifecycle—not one trade
The investable AI chain contains several potential profit pools:
Capital → chips → networks → data centers → power → models → platforms → applications → industry adoption
The winner can change by phase.
Infrastructure may lead during scarcity. Hyperscalers may capture distribution. Software may capture workflow value. Industrial, financial, consumer and life-science companies may capture productivity.
The portfolio should be able to participate if value moves downstream.
Five construction rules
- Own the lifecycle. Hold infrastructure, platforms, applications and adopters.
- Cap hard infrastructure. Direct compute, power and data-center exposure should not dominate.
- Use liquid baskets. Prefer ETFs where single-company outcomes are unusually uncertain.
- Do not borrow. A long-duration thesis should not depend on short-duration financing.
- Rebalance. Do not allow yesterday’s winner to become tomorrow’s entire portfolio.
This is participation without financial leverage. The upside comes from exposure to AI growth—not from borrowing against it.
Four portfolio variants
| AI lifecycle sleeve | Quality & Adoption | Balanced Lifecycle | Downstream Convexity | Application Capture Alpha |
|---|---|---|---|---|
| Broad U.S., Nasdaq and quality | 25% | 20% | 12% | 5% |
| Active full-stack AI funds | 10% | 14% | 14% | 18% |
| Hyperscalers and model platforms | 14% | 13% | 11% | 10% |
| Compute, memory and networking | 8% | 11% | 10% | 5% |
| Power, grid and data-center infrastructure | 5% | 7% | 6% | 5% |
| Data, security and developer tools | 7% | 7% | 10% | 13% |
| Enterprise SaaS and AI applications | 10% | 10% | 14% | 22% |
| Physical AI, robotics and autonomy | 4% | 5% | 8% | 10% |
| AI-enabled industry adopters | 11% | 8% | 10% | 3% |
| Listed venture and startup access | 0% | 1% | 3% | 3% |
| Gold | 6% | 4% | 2% | 6% |
| Total | 100% | 100% | 100% | 100% |
Quality & Adoption gives more weight to broad equities, profitable businesses and gold.
Balanced Lifecycle is the reference portfolio. It distributes exposure across the full chain.
Downstream Convexity takes more application, robotics, software and listed-startup risk.
Application Capture Alpha is the aggressive, unlevered 20%+ thesis test. Sixty-six percent sits in active AI, data/security, applications, robotics and listed-venture access. It has 5% broad-market ballast and 6% gold, funded by trimming hyperscalers, data/security and robotics by two points each.
How the sleeves can be implemented and evaluated
| Sleeve | Modeled implementation | Comparable ETFs, indices or assets |
|---|---|---|
| Broad U.S., Nasdaq and quality | QQQM, RSP, QUAL, USMV | SPY, QQQ, VTI, XLK |
| Active full-stack AI | BAI | AIQ, ARTY, THNQ, CHAT, LRNZ, AIS |
| Hyperscalers and platforms | MSFT, GOOGL, AMZN, META, ORCL | QQQ, XLK, MAGS |
| Compute and networking | SMH | SOXX, XSD; NVDA, AVGO, AMD, ANET, AMAT |
| Power, grid and data centers | GRID, PAVE | XLU, NLR, URA, SRVR, DTCR; VRT, ETN, GEV, PWR, EQIX, DLR |
| Water and cooling substitution | Indirectly represented in infrastructure baskets | PHO, CGW; XYL, ECL, AWK |
| Data and security | CIBR; CRWD, PANW, DDOG and NET in Alpha | HACK, IHAK, BUG |
| SaaS and AI applications | IGV, WCLD; PLTR, NOW, CRM, SNOW, ADBE and INTU in Alpha | CLOU, SKYY |
| Robotics and autonomy | ARKQ | BOTZ, ROBO, IRBO |
| AI-enabled adopters | XBI, PPA, XLI, XLF, XLY | Sector indices and equal-weight industry baskets |
| Listed venture access | RVI | IPO; VCX as a separate watch item |
| Gold | GLDM | GLD, IAU, SGOL |
The alternatives are evaluation tools or possible substitutions—not extra allocations. Adding all of them would create duplication and rebuild the concentration this design is trying to avoid.
The 18% direct hard-infrastructure weight in the Balanced portfolio also understates its effective AI-capex sensitivity. BAI, QQQM and the hyperscalers contain additional embedded exposure.
The safety jacket is not a lifeboat
The Balanced portfolio has 4% gold and 20% broad or quality exposure. It also owns profitable platforms and industry adopters.
That may soften some shocks.
It does not make the portfolio defensive. Approximately 96% remains in equities or equity-like vehicles. In a synchronized technology liquidation, most sleeves can fall together.
Gold is a small diversifier. Broad equities reduce theme concentration. Neither guarantees capital protection.
Three different calculations
The model separates three questions that should not be blended:
- Historical proxy record: what return, volatility and drawdown the present-day allocation would have produced in the past.
- Forward regimes: what one-, three- and five-year endpoints result from assumed sleeve returns.
- Extreme stresses: what happens when several sleeves are shocked simultaneously.
A forward return assumption does not determine a unique future volatility or maximum drawdown. Historical volatility and drawdown are therefore shown as reference anchors—not predictions.
What the last ten years would have looked like
The following is a quarterly rebalanced proxy from August 15, 2016 through August 14, 2026.
| Series | Annualized return | Volatility | Maximum drawdown | Sharpe |
|---|---|---|---|---|
| S&P 500 proxy | 15.3% | 18.0% | -33.7% | 0.76 |
| Nasdaq-100 proxy | 20.9% | 22.5% | -35.1% | 0.86 |
| Quality & Adoption | 20.0% | 20.5% | -34.6% | 0.89 |
| Balanced Lifecycle | 21.3% | 21.8% | -36.8% | 0.89 |
| Downstream Convexity | 21.0% | 22.9% | -39.7% | 0.85 |
| Application Capture Alpha | 25.0% | 24.5% | -44.0% | 0.95 |
Application Capture Alpha had the highest modeled historical return and Sharpe, but also the highest volatility and deepest drawdown. Its younger direct holdings use explicit proxy chains, so the result has material look-ahead and substitution bias.
This is not evidence that Balanced will win next time. It is evidence that diversification did not automatically eliminate equity risk.
Important proxy limitation
Several current vehicles did not have a complete ten-year history. The model therefore uses disclosed substitutes: QQQ for QQQM, GLD for GLDM, IGV before WCLD’s inception, XLI before PAVE’s inception, IPO for RVI, a transparent QQQ/SMH/IGV/ARKQ blend for BAI, CIBR before CRWD/DDOG/NET, and IGV before PLTR/SNOW.
These are portfolio proxies—not the historical performance of the newer funds.
One-, three- and five-year possibilities
The model uses four market regimes. Each regime is applied separately to all four portfolio variants. The regimes are not additional portfolios, and none has an assigned probability.
Portfolio return is calculated as:
sum of (portfolio sleeve weight × sleeve scenario return)
Year 1 is modeled separately. The Years 2–5 annual assumption then compounds from the Year 1 endpoint.
| Regime | Portfolio | 1Y return | 3Y annualized | 3Y value of $100 | 5Y annualized | 5Y value of $100 |
|---|---|---|---|---|---|---|
| High-conviction AI diffusion | Quality & Adoption | 19.0% | 16.6% | $159 | 16.1% | $211 |
| High-conviction AI diffusion | Balanced Lifecycle | 19.9% | 17.2% | $161 | 16.7% | $217 |
| High-conviction AI diffusion | Downstream Convexity | 22.4% | 19.3% | $170 | 18.7% | $236 |
| High-conviction AI diffusion | Application Capture Alpha | 24.6% | 21.0% | $177 | 20.3% | $252 |
| AI acceleration | Quality & Adoption | 22.5% | 17.3% | $161 | 16.3% | $212 |
| AI acceleration | Balanced Lifecycle | 24.4% | 18.4% | $166 | 17.2% | $221 |
| AI acceleration | Downstream Convexity | 26.2% | 19.8% | $172 | 18.5% | $234 |
| AI acceleration | Application Capture Alpha | 26.5% | 20.2% | $173 | 18.9% | $238 |
| Capex buildout and monetization lag | Quality & Adoption | 4.9% | 7.4% | $124 | 7.8% | $146 |
| Capex buildout and monetization lag | Balanced Lifecycle | 5.1% | 7.6% | $125 | 8.1% | $148 |
| Capex buildout and monetization lag | Downstream Convexity | 4.7% | 7.8% | $125 | 8.4% | $150 |
| Capex buildout and monetization lag | Application Capture Alpha | 4.4% | 7.7% | $125 | 8.4% | $150 |
| High-conviction application capture | Quality & Adoption | 20.1% | 17.4% | $162 | 16.9% | $218 |
| High-conviction application capture | Balanced Lifecycle | 20.8% | 17.9% | $164 | 17.4% | $223 |
| High-conviction application capture | Downstream Convexity | 23.9% | 20.3% | $174 | 19.6% | $245 |
| High-conviction application capture | Application Capture Alpha | 26.7% | 22.4% | $183 | 21.5% | $265 |
Why build four different portfolios?
There is no single way to invest in the AI lifecycle. The four variants express different views about where value will be captured—by diversified adopters, across the full stack, in downstream software and robotics, or in a concentrated application-led portfolio.
| Portfolio | AI value-chain target | Allocation logic | Why its modeled returns differ |
|---|---|---|---|
| Quality & Adoption | Profitable technology, broad U.S. equities and industries adopting AI | 25% broad/quality, 11% sector adopters and 6% gold; less active AI, software and robotics risk | Usually has the lowest upside in strong AI regimes because more capital sits in diversified and lower-beta sleeves. That same structure produces the lowest historical volatility and drawdown of the four. |
| Balanced Lifecycle | The complete chain from compute and power through platforms, applications and adopters | No layer dominates: 20% broad/quality, 18% hard infrastructure, 13% hyperscalers and meaningful downstream exposure | Returns sit near the middle because infrastructure leadership and downstream value capture can offset each other. It is the reference construction, not a maximum-return portfolio. |
| Downstream Convexity | Software, security, robotics and listed-startup participation | 49% across active AI, data/security, applications, robotics and listed venture; only 14% in broad equity and gold | Produces higher diffusion and application-capture returns because more weight reaches the sleeves with the strongest assumptions. It also carries greater duration, valuation and liquidity risk. |
| Application Capture Alpha | Maximum exposure to enterprise applications, data/security and high-growth AI platforms | 66% across active AI, data/security, applications, robotics and listed venture; 5% broad equity and 6% gold | Has the highest modeled diffusion and application-capture returns because the portfolio is deliberately concentrated in the assumed winners. Gold lowers the tail risk, but does not make it defensive. |
How the allocations create the return differences
The returns are not assigned directly to a portfolio. Each portfolio receives the same sleeve-level assumptions within a regime, and its result is the weighted sum of those assumptions.
- In AI diffusion, applications, active AI, security and robotics receive stronger assumptions than broad equities or gold. Downstream Convexity and Application Capture Alpha therefore produce the higher modeled returns.
- In AI acceleration, compute, networking, power and hyperscalers also perform strongly. Balanced Lifecycle benefits more from those layers, narrowing the gap with the aggressive portfolios.
- In capex buildout with monetization lag, physical spending continues but application revenue takes longer to arrive. The four returns cluster around 4%–5% in Year 1 because every construction owns some lower-return or delayed-monetization sleeves.
- In application capture, enterprise software, security, robotics and active AI receive the highest assumptions. Application Capture Alpha rises to 26.7% in Year 1 because 63% is allocated to those four sleeves alone.
This is the central portfolio choice: target the whole AI lifecycle for balance, emphasize infrastructure when physical bottlenecks are expected to dominate, or accept more volatility to target downstream application and productivity gains. The outputs are theoretical scenario arithmetic—not expected returns or probabilities.
Extreme scenarios
| Shock | Quality | Balanced | Convexity | Application Alpha |
|---|---|---|---|---|
| 2000-style multiple compression | -43.3% | -46.0% | -49.9% | -51.0% |
| 2022-style real-rate shock | -30.5% | -31.8% | -34.3% | -35.4% |
| Financing and liquidity closure | -31.9% | -34.1% | -37.1% | -36.9% |
| Advanced-chip geopolitical disruption | -20.4% | -21.8% | -23.3% | -22.1% |
| Application-value-capture rotation | +12.3% | +11.6% | +14.2% | +17.0% |
A 51.0% loss requires a 103.9% gain to recover. Gold reduces the modeled loss and recovery hurdle, but the portfolio remains equity-dominant.
That arithmetic is why this model rejects leverage even when the long-run AI thesis is optimistic.
Why the idea may remain valid
The economic case is not based on one company.
- AI infrastructure remains a major capital cycle.
- Enterprise adoption is broadening beyond model training.
- Power, grid and interconnection constraints are becoming economically relevant.
- Value capture may rotate from hardware toward platforms, software and adopters.
The current environment is not frictionless. As of July 29, 2026, the Federal Reserve’s target range was 3.50%–3.75%. The IMF projected U.S. real growth of 2.3% in 2026 and 2.2% in 2027. That supports continued investment, but not unlimited valuation or cheap financing.
Gartner estimated 2026 worldwide AI spending at $2.596 trillion, with infrastructure representing more than 45%. Morgan Stanley estimated nearly $2.9 trillion of data-center construction and related infrastructure through 2028. Lawrence Berkeley National Laboratory estimated that U.S. data centers could consume 11.8% of national electricity by 2030, with a wide 9.5%–15.3% range.
The IEA’s April 2026 update similarly reported that capital expenditure by five large technology companies exceeded $400 billion in 2025 and was set to rise substantially again in 2026. It also emphasized that grid connections, transformers, turbines, chips and other physical bottlenecks can delay deployment even when demand remains strong. (IEA)
Those numbers support the existence of a buildout. They do not tell us which security will outperform.
What would invalidate it
The thesis weakens if several of these occur together:
- hyperscalers cut capital-expenditure guidance;
- GPU rental prices and utilization fall persistently;
- enterprise AI revenue fails to cover inference and implementation costs;
- application vendors cannot defend margins against platform bundling;
- grid projects stall while planned capacity continues to grow;
- financing spreads widen and private marks remain stale;
- valuations rise while earnings revisions deteriorate;
- or the portfolio’s effective AI-factor concentration keeps increasing after rebalancing.
No single data point ends the thesis. A cluster of weakening demand, financing and market breadth would.
What are its chances of success?
An honest probability cannot be extracted from a ten-year backtest or four hand-built scenarios.
The structure has a reasonable chance of remaining relevant because it owns several potential value-capture layers. It does not require semiconductors to lead for all five years.
But success is conditional—not assured.
The diversified variants can still lose 35%–50% in a severe equity reset; the aggressive Application Capture Alpha stress reaches roughly -51%. Any variant can trail QQQ during an infrastructure boom and trail the S&P 500 when technology valuations compress.
The strongest claim is therefore modest:
This is a more survivable way to test the AI investment thesis—not a reliably safe or market-beating portfolio.
The public scorecard
The experiment begins at 100 on August 14, 2026.
It will be reviewed quarterly against:
- SPY for broad U.S. equities;
- QQQ for large technology;
- SMH for concentrated AI infrastructure;
- IGV for software;
- and GLD for gold.
Each update should publish:
- total return;
- volatility;
- maximum drawdown;
- current sleeve weights;
- performance by AI lifecycle layer;
- changes to forward assumptions;
- and whether any invalidation signal has appeared.
Every allocation change should be timestamped before measuring later performance. The original baseline should never be rewritten after the result is known.
The formal checkpoints are one year, three years and five years.
Final thought
AI may reshape software, industry and the physical economy.
That does not mean every AI company wins. It does not mean infrastructure leads forever. It does not make valuation irrelevant. And it does not make leverage safe.
The portfolio proposed here owns the buildout, the platforms, the applications and some of the companies expected to use AI.
All four variants now keep a small gold safety jacket. Application Capture Alpha remains the most aggressive because 89% is still in AI-focused or AI-adoption equity sleeves and only 5% is broad-market ballast.
The objective is not to predict the future perfectly.
It is to participate in several plausible futures—and remain invested long enough to discover which one arrives.
Methodology and sources
The historical model uses adjusted public-market prices through August 14, 2026, quarterly target rebalancing and no taxes, fees, slippage or leverage. It applies today’s selected portfolio to the past and therefore contains look-ahead and survivorship bias. Forward and stress returns are editable assumptions rather than statistical forecasts.
Primary context:
- Federal Reserve, July 29, 2026 policy statement
- IMF, July 2026 World Economic Outlook Update
- Federal Reserve, The AI Buildout and the Economy
- Gartner, 2026 worldwide AI spending forecast
- Morgan Stanley, AI market trends and infrastructure
- Goldman Sachs, corporate AI investment and value capture
- Lawrence Berkeley National Laboratory, U.S. data-center energy use
- IEA, 2026 update on AI, data centers and physical bottlenecks
- Amazon, fourth-quarter 2025 results and 2026 capital-expenditure outlook
- Eaton, first-quarter 2026 data-center orders and backlog
- GE Vernova, second-quarter 2026 data-center orders
- Microsoft, fiscal-2026 Q3 AI monetization metrics
- ServiceNow, second-quarter 2026 results
- Salesforce, first-quarter fiscal-2027 results
- Snowflake, first-quarter fiscal-2027 results
- Palantir, first-quarter 2026 business update
- Adobe, second-quarter fiscal-2026 results
- Yahoo Finance historical market data
- Earlier Situational Awareness portfolio-risk case study
Final disclaimer: This framework is for public education and research. It is not personalized financial advice, and the author may be wrong about the technology, the industries, the securities, the macroeconomic environment, the assumptions and the calculations. Investors can lose some or all of their capital.